Sensitivity Analysis
Dear All,
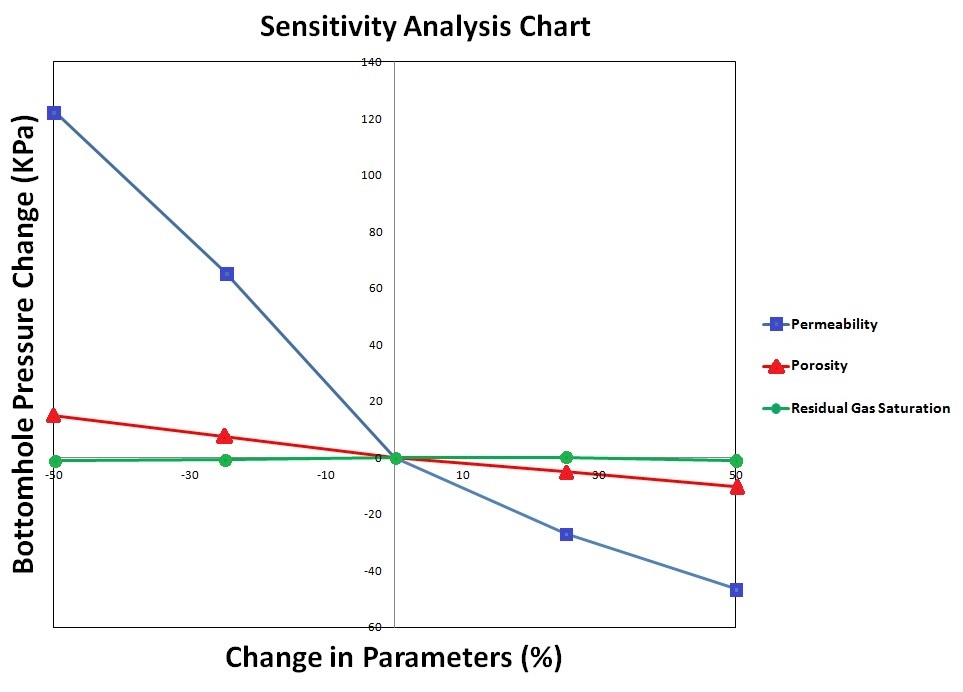
After running a CO2 injection model, I performed a sensitivity analysis to determine the sensitivity of my model with respect to some key input parameters (i.e., porosity, permeability, residual gas saturation, etc.). Changes of 25 and 50 percent were applied to the selected parameters and resulting bottom-hole pressure (BHP) values at the observation well (X=150 m) were obtained. As you can see in the figure, model shows the highest sensitivity against the permeability vaiations but the slope of the blue line is not symmetric for both negative and positive changes, indicating that model shows higher sensitivity against decreasing the permeability.
I am wondering if anybody knows the reason for that.
I would greatly appreciate if you kindly give me some advice.
Best regards
Ramin
3 replies
-
Ramin,
This is a reflection TOUGH2 outputs being nonlinear in the parameters. Without knowing the details of the model you are running, I cannot speculate about the reasons for the specific behavior you see in your sensitivity plot. Consider, however, the well-known fact that in a serial flow configuration, it is the lower permeabilities that determine the effective behavior of the system, whereas the higher permeabilities become irrelevant as the contrast increases.
I would like to take the opportunity to alert you to iTOUGH2's (local and global) sensitivity analysis features, which allow you to obtain composite sensitivity measures and to quantify the degree of nonlinearity. The following references discuss sensitivity analysis in the context of TOUGH2 simulations:
Wainwright, H., S. Finsterle, Y. Jung, Q. Zhou, and J.T. Birkholzer, Making sense of global sensitivity analyses, Computers & Geosciences, 65, 84–94, doi:10.1016/j.cageo.2013.06.006, 2014.
Wainwright, H.M., S. Finsterle, Q. Zhou, and J.T. Birkholzer, Modeling the performance of large-scale CO2 storage systems: A comparison of different sensitivity analysis methods, International Journal of Greenhouse Gas Control, 17,189–205, doi:10.1016/j.ijggc.2013.05.007, 2013.
Finsterle, S., Practical notes on local data-worth analysis, Water Resour. Res., 51(12), 9904–9924, doi: 10.1002/2015WR017445, 2015.
Finsterle, S., Y. Zhang, L. Pan, P. Dobson, and K. Oglesby, Microhole arrays for improved heat mining from enhanced geothermal systems, Geothermics, 47, 104–115, doi:10.1016/j.geothermics.2013.03.001, 2013.
I hope this is useful,
Stefan
-
Stefan,
I really appreciate it . It was useful.
Sincerely yours
Ramin
-
Ramin Dear Ramin
I am not sure if you are Iranian or not? I just started to simulate a wellbore stimulation. I would be thankful, If I could have a more easy way to contact you (say Telegram or Linkedin).
My full name is Ali Mehrabifard studying in Seoul National University,
Thanks in advance for your consideration.Regards,
Ali