EWASG
Here's the English translation of your request:
"Hello, I am using the **EWASG module** for **hydrogen storage in an aquifer**, but the OUT file is reporting an error. Did I set any parameters incorrectly? I hope to get help. Below is a screenshot of the error message, **attached with the input files**."image
14 replies
-
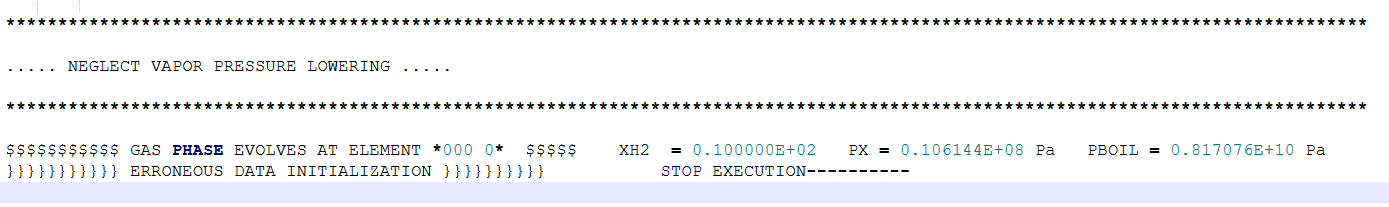
The message tells you there is a phase transition from L to L+G at the very first iteration, which is not allowed. The appearance of gas phase occurs because of a wrong initialization of the third primary variable X3=10.0, which makes no sense, as it is interpreted as the mass fraction of H2 in the liquid phase.
$$$$$$$$$$$ GAS PHASE EVOLVES AT ELEMENT *000 0* $$$$$ XH2 = 0.100000E+02 PX = 0.106144E+08 Pa PBOIL = 0.817076E+10 Pa
}}}}}}}}}}} ERRONEOUS DATA INITIALIZATION }}}}}}}}}} STOP EXECUTION----------I guess you want to initialize a single-liquid system for which X3 should be the mass fraction of hydrogen dissolved in the aqueous phase. This value must be lower than H2 solubility at local P&T conditions.
Have a look to the user's guide and the informative printout in the output file.
***************************************************************************************
THE PRIMARY VARIABLES ARE
P - PRESSURE XSM - SALT MASS FRACTION IN LIQUID (XS) OR SOLID SATURATION (SS+10.)
X3 - NCG MASS FRACTION OR SG+10. - GAS PHASE SATURATION + 10. T - TEMPERATURE***************************************************************************************
* COMPONENTS * * FLUID PHASE CONDITION PRIMARY VARIABLES * ************************************************************************************** *
* # 1 - WATER * * SINGLE-PHASE GAS P, XSM, X3, T *
* # 2 - NaCl * * SINGLE-PHASE LIQUID P, XSM, X3, T *
* # 3 - NCG * * TWO-PHASE P, XSM, SG+10., T *
* # 4 - HEAT ****************************************************************************************
Be aware that the thermodynamic approach in EWASG is not accurate at very high partial pressures of the NCG, such as in your simulation of H2 storage in an aquifer with pressures around 100 bar.
Regards,
Alfredo
-
Dear Gao,
H2 was included as an optional NCG inside EWASG with a treatment of water-H2 mixture very similar to what is done in EOS5.
The density of gaseous H2 is evaluated with the ideal gas law in both EOS.
The viscosity of gaseous H2 is evaluated with the same routine using data from Vargaftik (1975).
The enthalpy of gaseous H2 is computed using a constant specific heat in EOS5, while is computed according to Irvine and Liley (1984) correlation in EWASG.
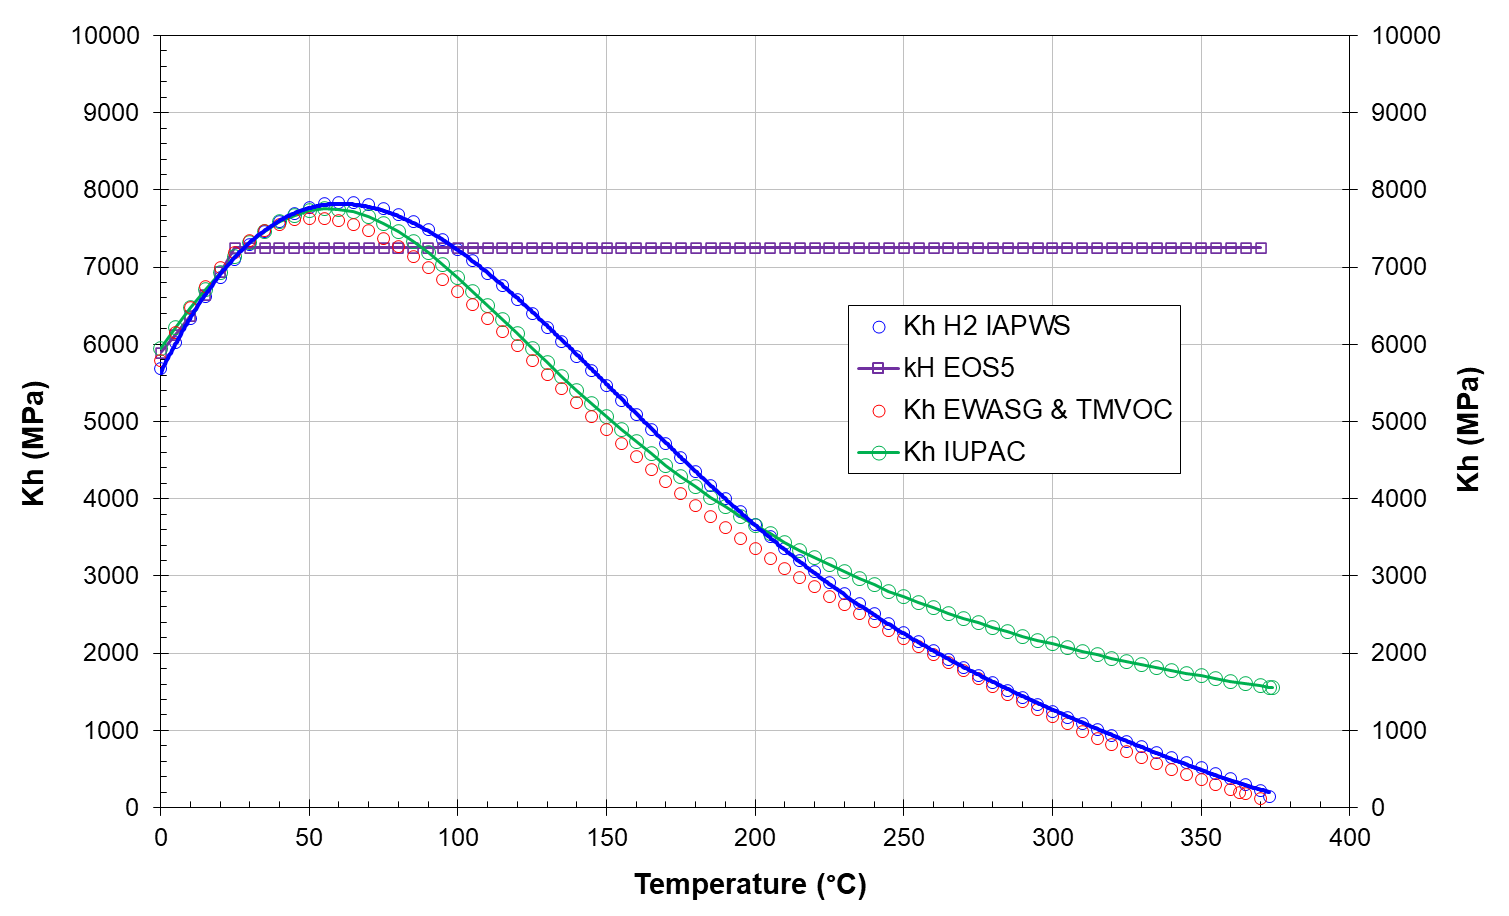
One of the major differences is in the H2 solubility in liquid water. In EOS5 there is a linear relationship for Henry's constant between 0 and 25°C, then the 25°C value is kept constant at T>25°C.
In EWASG H2 Henry's constant is a function of T from 0 to 370°C. The two Henry's constants are shown in the figure below.
In addition, in EOS5 the contribution of dissolved H2 on the enthalpy of aqueous phase is neglected, while in EWASG is accounted for. But H2 solubility is very low, so related effects should not be very important.
Another difference is related to the effects of dissolved salts, in EWASG simulated using NaCl as a proxy fro TDS. If the salinity in your aquifer is low (less than a couple tens of thousands ppm), the pure water properties of EOS5 are almost equivalent to the brine properties computed by EWASG. At higher salinities, you may start to see the differences between water and brine properties.
To have an idea of the reliability of EOS5 and EWASG EOS approaches in the calculation of phase properties at high H2 partial pressure, what I can suggest is to use the two EOS to compute H2 properties as function of P&T and then compare that properties to a suitable source, such as the on-line NIST calculator for fluid properties (https://webbook.nist.gov/chemistry/fluid/). In that way you may chose the more reliable EOS and have an idea about the approximations involved in using it.
Regards,
Alfredo
-
The T is changing at the injection element T1717:
T1715 34118 0.10028E+08 0.29773E+02 0.49812E+00 0.50188E+00 0.00000E+00 0.19998E-01 0.99632E+00 0.15183E-03 -.10815E+04 0.10000E+01 0.10125E+04
T1716 34119 0.10039E+08 0.27806E+02 0.54849E+00 0.45151E+00 0.00000E+00 0.20014E-01 0.99672E+00 0.15324E-03 -.11102E+04 0.10000E+01 0.10131E+04
T1717 34120 0.10059E+08 0.14330 E+02 0.61696E+00 0.38304E+00 0.00000E+00 0.20113E-01 0.99857E+00 0.16649E-03 -.11549E+04 0.10000E+01 0.10159E+04
T1718 34121 0.10039E+08 0.27808E+02 0.54845E+00 0.45155E+00 0.00000E+00 0.20014E-01 0.99672E+00 0.15324E-03 -.11102E+04 0.10000E+01 0.10131E+04
T1719 34122 0.10028E+08 0.29773E+02 0.49803E+00 0.50197E+00 0.00000E+00 0.19998E-01 0.99632E+00 0.15183E-03 -.10814E+04 0.10000E+01 0.10125E+04The T change is low because the mass injection rate is very low, only 0.015 kg/s
GENER----1----*----2----*----3----*----4----*----5----*----6----*----7----*----8
T1717A0001 0 0 0 1 COM3 1.500E-02 0.000E+00 0.000E+00By the way, you have not assigned the enthalpy for the injected H2, which is then taken equal to 0. J/kg by TOUGH2. You should evaluate the H2 enthalpy at injection conditios and use it in GENER.
I would also suggest using MOP(11)=2.
-
Dear Gao,
it seems you have assigned a max time of 1.5552E7 s under GENER
GENER----1----*----2----*----3----*----4----*----5----*----6----*----7----*----8
P1717A0001 0 0 0 3 COM3 0.000E+00 0.000E+00 0.000E+00
0.000000E+00 1.296000E+07 1.555200E+07
1.280000E-01 1.280000E-01 0.000000E+00Then your simulation simply goes beyond this time and TOUGH2 does not know which rate to use.
O3232( 17, 4) ST = 0.131071E+08 DT = 0.655360E+07 DX1= 0.155844E+02 DX2= -.346122E-08 T = 30.313 P = 9917425. S = 0.941512E-01
0.262143E+08 IS OUTSIDE THE RANGE ( 0.0000E+00, 0.1555E+08)
AT KCYC = 18 EXCEED GENERATION TIME TABLE AT ELEMENT P1717 (SOURCE A00 1) -- WILL REDUCE DELTEYou should simply extend the time-rate data to the time foreseen in your input file (4.908E+14 s).
You are running a non-isothermal simulation (NEQ=4). Thus, you must assign the enthalpy of injected NCG, otherwise its enthalpy is assumed to be 0 J/kg.
You wrote you are first simulating the injection of an N2 cushion gas, to simulate the injection of H2 afterward. This is not possible in EWASG, as the EOS can simulate just one NCG, either N2 or H2, as it is clearly stated in the user's guide.
You need an EOS able to simulate at least 2 gases, including N2 and H2. In the TOUGH2 release, I'm afraid no EOS is able to model N2 and H2 together. The TMVOC version released in 2002 can simulate mutiple NCGs, but at the time H2 was not included in the internal NCG databank. A TMVOC version with many more NCGs, including H2, has been developed at Saipem SpA (Modeling Multiphase Organic Spills in Coastal Sites with TMVOC V.2.0, VZJ, 2014) but that version has never been distributed.
TOUGH3 should not have an EOS with these capability, but others may give a more detailed answer about TOUGH3 capabilities.
N2 and H2 can be simulated with EOS7 and EWASG versions supported by TOUGH4, which is under testing and not yet released. You may look at the invitation to test TOUGH4 (https://tough.forumbee.com/t/x2yfrfj#:~:text=Invitation%20for%20TOUGH4%20testing).
Regards,
Alfredo
-
Dear Gao,
I'm sorry but I have no time to go deep into your problem. I can just make some comments, hoping they can help you.
- better not to start with a 60,000+ element problem. Start with a small idealized problem similar to the final one and check if petrophysical properties, initial conditions, sink/sources chosen make your simulation to work properly. Once the small problem runs, go to the more complex one.
- the convergence issues starts early, when they are overcome with time step reductions, but finally the time step required to go on is too smal that the simulation converges at the first iteration. Then the game is over when next time step does not converge. Other versions of TOUGH2 (such as that supported by PetraSim) allows to force at least 1 NR iteration, so this run stop is avoided. But this fix is usually useful when approaching a steady state, not in this case.
- the input files do not seem to correspond to the output file. MOP(5)=3 is assigned in the input file, but no messages about phase transitions are printed in the output files. In a smooth run these messages can be avoided as they would be too many, but in your case you need to have the phase transition printout to check if the convergence issue is related to phase changes (as it is likely!).
- I add a look to RELP and PCAP, because when a L-->L+G transition occurs due to the appearance of the gas phase, issues may occur because of RELP and PCAP shape at SL near 1.0.
I looked at one of the elements having issues before the run stop: 40313. it belongs to material MIDDL.
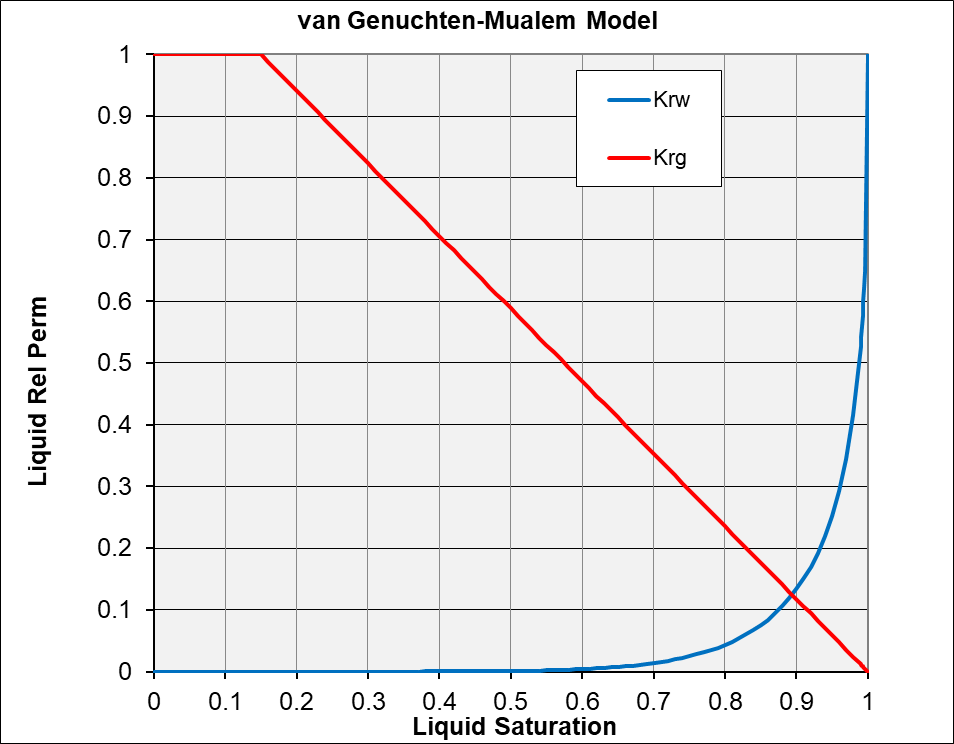
You used VG's model for both L (W) and G phases. The Krw changes very fast as SL decreases below 1.0. This imply high values for the derivative d(Krw)/d(Sw) which may affect the convergence process. The Krg has an almost linear trend, with SGR=0.
You use VG's model for PCAP. The Pcap values are rather small reaching 1 bar only at SL=0.30. Then values increase when SL approaches SLR=0.15 with a max value set at 1.E9 Pa (!).
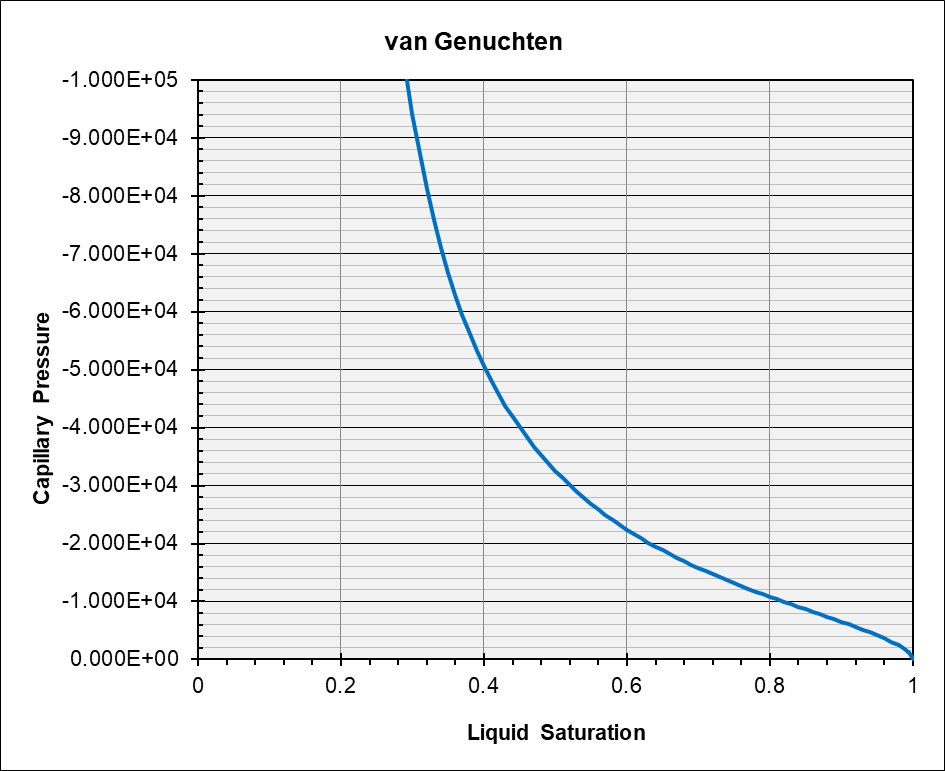
This asymptotic behaviour is not physical, and often it is better to use SLR=0 and reduce the max value to reasonable values related to the permeability of the formation.
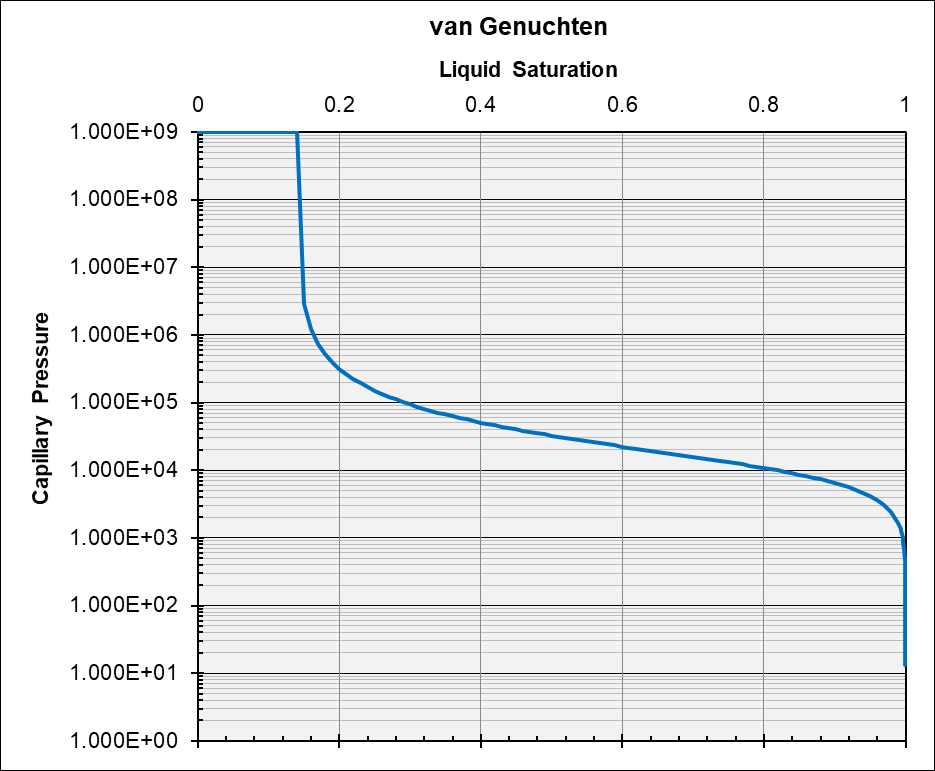
Apart for some improvements in RELP and PCAP, the chosen curves are probably not fully responsible for the convergence issue. I would any way reduce the steep decline of Krw when SG increases above 0.
- in my experience including a small gas entry P in the PCAP curve usually makes the apperance of gas phase easier with less iterations, because it reduces the steep increase of VG's PCAP when the gas phase appears. With a slightly modified PCAP subroutine is it possible to assign SLS>1.0, and this introduces a gas entry pressure with PCAP < 0 at SL=1.0.
But I guess the version you are using does not allow that. This option is for instance available under the version supported by PetraSim (Battistelli et al., 2017). Modification of PCAP subroutine is easy but you need the source code.
- There are multiple cases in which the code needs to reduce the time step before the final stop.
They look like that:
54646( 41, 1) ST = 0.240865E+07 DT = 0.202368E+03 DX1= 0.000000E+00 DX2= 0.000000E+00 T = 31.035 P = 9967335. S = 0.928115E-01
...ITERATING... AT [ 42, 1] --- DELTEX = 0.404736E+03 MAX. RES. = 0.195015E-04 AT ELEMENT 54646 EQUATION 2
...ITERATING... AT [ 42, 2] --- DELTEX = 0.404736E+03 MAX. RES. = 0.362579E-04 AT ELEMENT 405 9 EQUATION 3
...ITERATING... AT [ 42, 3] --- DELTEX = 0.404736E+03 MAX. RES. = 0.110198E-03 AT ELEMENT 406 6 EQUATION 3
...ITERATING... AT [ 42, 4] --- DELTEX = 0.404736E+03 MAX. RES. = 0.485640E-04 AT ELEMENT 40313 EQUATION 3
...ITERATING... AT [ 42, 5] --- DELTEX = 0.404736E+03 MAX. RES. = 0.610903E-04 AT ELEMENT 40711 EQUATION 3
...ITERATING... AT [ 42, 6] --- DELTEX = 0.404736E+03 MAX. RES. = 0.509536E-04 AT ELEMENT 40313 EQUATION 3
...ITERATING... AT [ 42, 7] --- DELTEX = 0.404736E+03 MAX. RES. = 0.610864E-04 AT ELEMENT 40711 EQUATION 3
...ITERATING... AT [ 42, 8] --- DELTEX = 0.404736E+03 MAX. RES. = 0.519865E-04 AT ELEMENT 40313 EQUATION 3
...ITERATING... AT [ 42, 9] --- DELTEX = 0.404736E+03 MAX. RES. = 0.610824E-04 AT ELEMENT 40711 EQUATION 3
+++++++++ REDUCE TIME STEP AT ( 42, 9) ++++++++++++++++ NEW DELT = 0.101184E+03
54646( 42, 1) ST = 0.240876E+07 DT = 0.101184E+03 DX1= 0.000000E+00 DX2= 0.000000E+00 T = 31.035 P = 9967335. S = 0.928115E-01
54646( 43, 1) ST = 0.240896E+07 DT = 0.202368E+03 DX1= 0.000000E+00 DX2= 0.000000E+00 T = 31.035 P = 9967335. S = 0.928115E-0From iteration 5 the elements with the maximum residual are 40711 and 40313. They are not connected. You can see that there is no improvement in the max res which is stagnating at the same values. Printing the phase transition messages would help in checking if this stagnating behaviour is linked to the apperance/disapearance of gas phase.
- one of the issues found when the gas phase appears and the gas plume migrates upward is the non smooth values of phase density interpolated at the interface of the vertical connections computed by TOUGH2 and used in the gravity term of Darcy's equation. This issue has been documented by researchers at the University of Auckland with a series of papers. It usually occurs when vertical migration of gas phase is controlled mainly by density driven flow.
A preliminary fix suggested was to compute the density of non existing phase to allow a smooth interpolation of phase density along vertical connections for the gravity term. This option is available in the EOS2 version supported by PetraSim (Battistelli et al., 2017). If I remember well, it is also available in ITOUGH2.
The final fix was a new interpolation algorithm to interpolate the density of phases which provides smooth density values in correspondance of phase apperance/disapperance. Unfortunately, this fix needs to be coded into sub MULTI. It is easy, but you need to have access to the source code and generate a new executable.
I'm not completely sure that the interpolation of density for the gravity term is the actual cause of the convergence issues, but it is a good candidate for that.
MOP(18) allows to chose different options for interface density used in the mobility term of Darcy's equation. You may change the default option =0 (upstream weighting) to >0 (average of the two grid blocks). This different choice of MOP(18) option does not affect the calculation of density for the gravity term, but a different convergence behaviour for the same input file might indicate that the interpolation of density is a possible cause for the poor convergence behavior.
Regards,
Alfredo
-
Dear Gao,
I'm not in the conditions to look at your files or run EOS7.
- I do not know why the enthalpy is zero in the OUTPUT file. May be the printout of enthalpy is not implemented in EOS7.
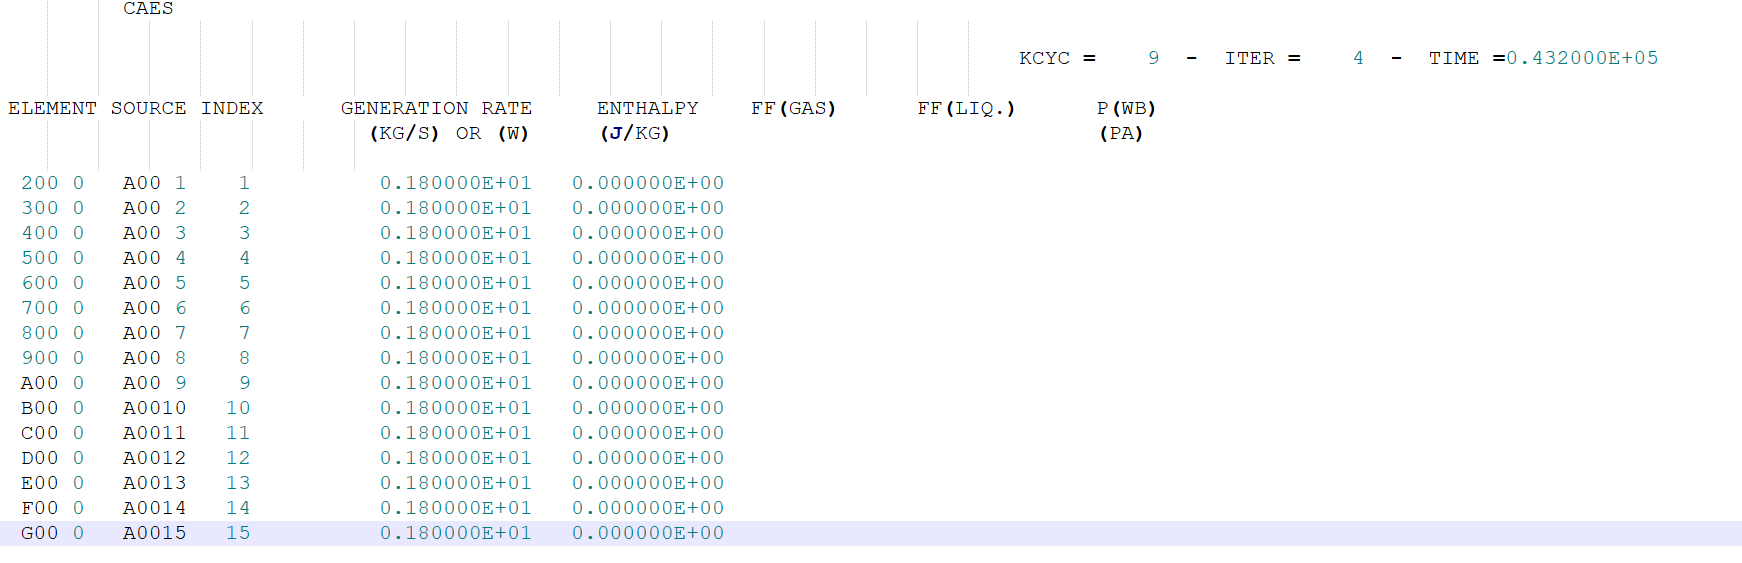
- to check the enthalpy value in the injection element you may extract with MASS a tiny flow rate and TOUGH2 should print out the enthalpy of extracted fluid and the fractional flow of liquid and gas phases. If you have assigned single gas phase with air only, you will get the enthalpy of air in gas conditions.
- for just one element you may ask TOUGH2 to printout the content of PAR array with all secondary parameters, including the enthalpy of both phases. Look at MOP options. I'm not sure if it is MOP(5)=8. Enthalpy should be in the 5th slot.
The printout is for each NR iteration, so to avoid a complex printout run for one, two time steps.
Regards,
Alfredo
PS: it would be better to start a new post when the topic changes.
-
Dear Gao,
For injections (positive rate in GENER), the enthalpy printed out is the one you specified, which in your case is indeed zero. So the output is as expected, confirming your input! Even though you're injecting a very cold fluid, the temperature in the injection element remains constant because of the high density/specific heat, as desired. Note that for production, the enthalpy is not an input, but calculated as an output variable, so you would see that calculated value associated with each sink. That is Alfredo's second suggestion (i.e., specify a small sink) - it works just fine.
If you want to see the enthalpy for each element at its respective temperature, simply set MOP(5)>0, which prints out the secondary parameter vector PAR; the enthalpy of each phase is the fifth value for the respective phase. Doing this for all elements at each iteration may create a very large output file. But you only need to do this for a single-element model initialized at 50C; only one time step is needed to get this information. You could also get the value from the NIST database.
Good luck,
Stefan