Tough2 EOS7C Gas Production Simulation Questions
I use EOS7C to simulate gas production for 2 years. The model includes 1 overburden layer, 1 underburden layer and 1 reservoir layer. After 2 years of gas production, I upload the save file and checked the result from Petrasim interface as shown in the following figure 1 (cross section through production interval. I have questions as follows:
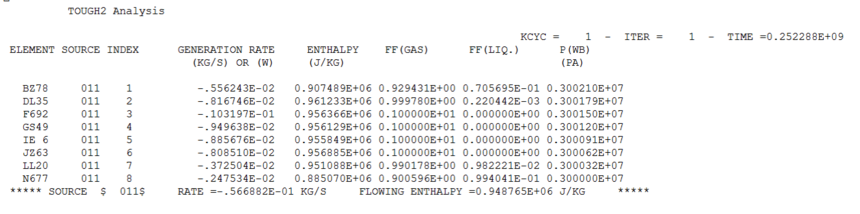
(1) It looks like the grey area (near by the production interval) is single phase. By clicking the cell data, the "Gas Saturation" is deactivated, does it mean this cell is in single fluid phase? however, when I check the output file as shown in following Figure 2, it shows this cell is 100 gas fraction.
(2) Another question is the final gas saturation. I set up the residual water saturation of 0.25 in the formation as seen from the following relative permeability curve, but the final gas saturation in some cell reaches 0.995. Why is that? Isn't that maximum gas saturation 0.75?


Does anyone have any idea what the problem might be? Thanks a lot for your help!
2 replies
-
Dear Wendy,
1) The output file contains the actual output of the run. Whatever the output file shows for saturation is what the run produced. I don't know how PetraSim works so cannot comment on what it shows for saturation.
2) Gas and liquid phase flow is controlled by permeability and relative permeability. But phase saturation can change by phase change, e.g., by evaporation or condensation, so gas or liquid saturations below the residual saturation can occur.
-Curt