Coupled reservoir-wellbore model initialization (using T2Well)
Hello everyone,
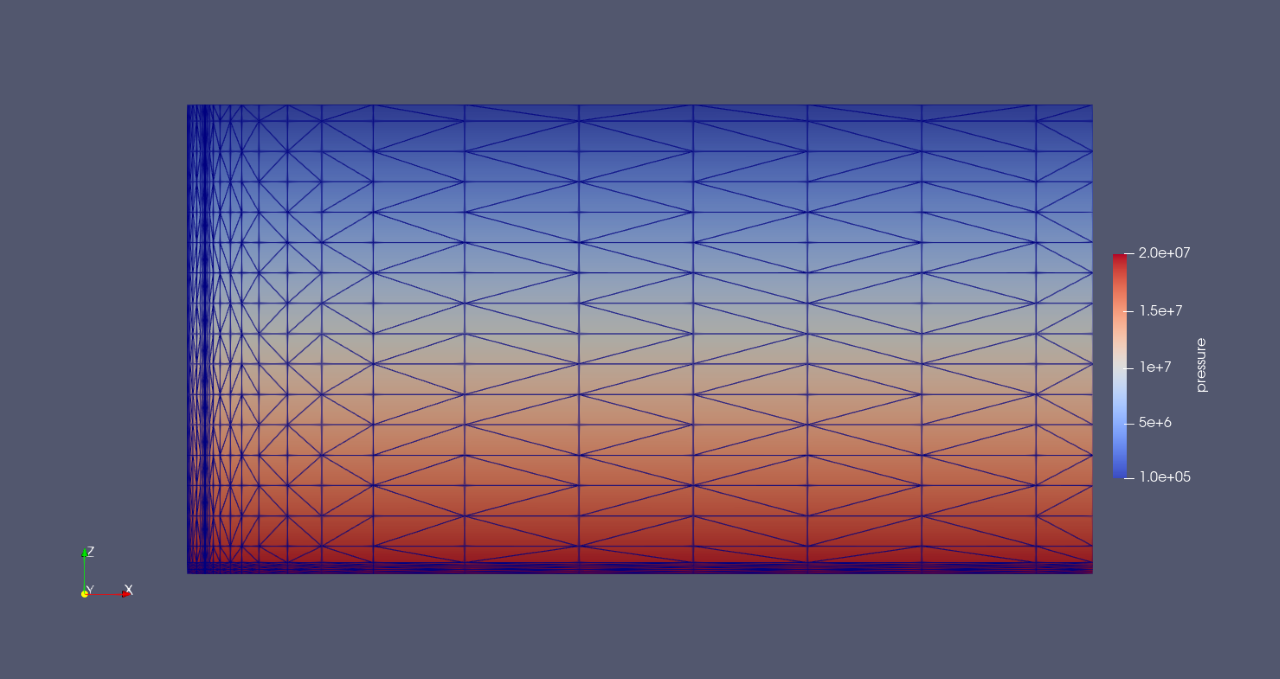
I have started using T2Well to simulate coupled reservoir-wellbore problems recently. While initializing the numerical model, I find the following problem; I have followed the same procedure that I follow with TOUGH3 to initialize the simulation. I have specified pressure and temperature for the grid cells which follow hydrostatic and geothermal gradient, respectively (as illustrated in the attached photos). I have tried to run the model with no generation terms to make sure that the model attains steady state conditions while observing pressure and temperature results in the specified monitoring well. I find strange behavior; temperature and pressure in the monitoring well oscillate!. I am not sure what is the reason for this behavior. I put the relative tolerance small value (1E-8) to obtain accurate initial results. This behavior occurs only in the wellbore cells; reservoir cells show steady state pressure and temperature results.
Thanks in advance.
17 replies
-
I recommend making the permeability of the well material equal to the reservoir permeability for the initialization run. With no sources or sinks, it does not need to have high permeability. Don't forget to change it back for your main simulation!
-
Try decreasing the wellbore permeability by a factor of 10. If that does not help decrease it more. You want wellbore permeability to be very high compared to reservoir permeability, but I have had trouble in the past with too high values, similar to what you are seeing. I was able to find a permeability that was high enough to act like a wellbore, but low enough to run without oscillations. I hope you can too.
-
I think you are correct that T=1 is too small for the EOS you are using. SATB is just the name of the subroutine where the code fails, but the important thing here is that for some reason the temperature has dropped out of bounds of the EOS and the code can't continue (takes tiny steps) because it does not know what any temperature-dependent properties are. Without knowing more about your problem I cannot guess why temperature has dropped so much. Unfortunately, I am not an experienced T2Well user. My general strategy when primary variables go out of bounds is to think about the physics of the problem. For example, if P is getting way too big, maybe you are injecting at too high a rate for the permeability you have. It can help to figure things out to use the FOFT block to choose several elements to watch over time - certainly you should be watching *1B14 and maybe other wellbore elements. It would be helpful to know if T was gradually decreasing for the whole 20 days, or if something happened around day 20 to cause T to suddenly drop. Similarly, if you make spatial plots of T at a series of times, it might help. Also, you might be able to make the problem easier by turning off certain features, then once you have a stable case, turn the features back on one by one to see what causes problems. Good luck!
-
I am generally familiar with how T2Well works, but I have not actually used it. I recommend that you look at the user's guide, and examine the governing equations for wellbore flow to see whether porosity, absolute permeability, and relative permeability are used.
In terms of a well going to the surface with CO2 in the problem, you need to be careful about possible CO2 phase changes from supercritical to liquid or gas. I believe you are using ECO2N as the equation of state, and it only allows one CO2 phase at a time to be present, so you have to avoid the liquid/gas saturation line and the critical point. See the figure below for the CO2 phase diagram and a couple of possible paths from depth to the surface. Both avoid the critical point and saturation line, but the one shown with black dots gets pretty close, which can cause numerical difficulties.
-
Sir, I also encountered the problem of temperature gradient disappearance during the initialization phase. How did you solve it? Please tell me the method. Thank you!
